Water Demand and Management Issues
Water is a scarce and limited resource. Water scarcity is a growing problem in many places of the world and is likely to only get worse as a result of climate change. With growing population and growing wealth in countries like China and India increasing pressures are placed on water reserves. In developing countries population pressure, agriculture and the emerging tourism industry all combine to increase the stress on water supply.
|
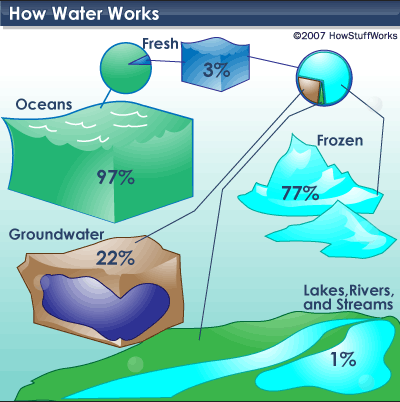
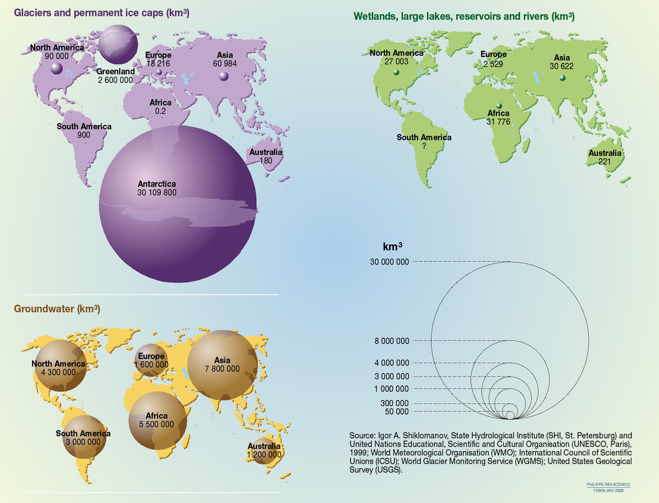
The world's freshwater is limited in its supply. Of all water on the planet, 97 percent is saltwater and found in the ocean, 3 percent is freshwater, of which 77 percent is locked in glaciers and icesheets and 22 percent is deep underground in aquifers. That leaves only 1 percent that is easily accessible in rivers, wetlands and lakes. Click on the map below to see the distribution of these freshwater reserves.
|
The Growing Demand for Water
As stated in the video above the annual growth in water is 2 percent a year, which amounts to 175 billion litres a day. This is an incredible amount of increased demand but what are the key reasons.
|
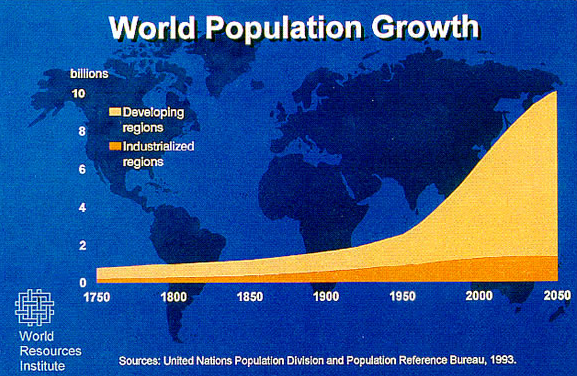
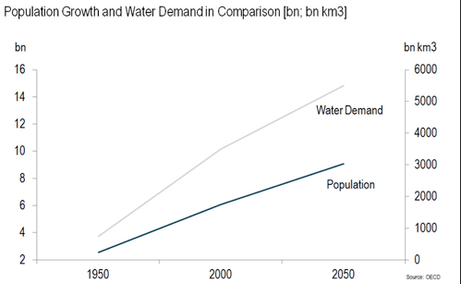
The main reason for the growth in demand for water is because of population growth. The graph shows population growth is highest in developing countries. Future growth to 2050 is only expected to come from developing countries. Unfortunately these regions are also the regions with greatest water shortage. The graph below which shows a slightly different projection for population growth shows how water demand grows at almost twice the rate of population growth.
|
|
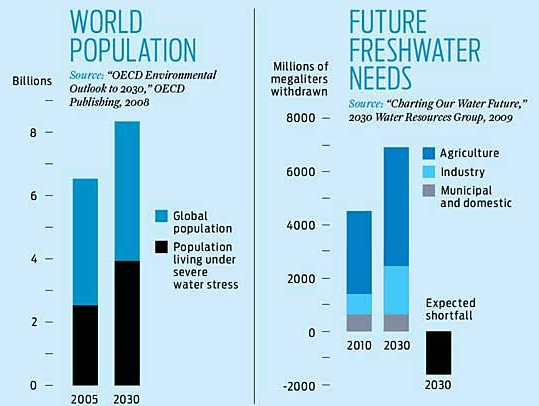
With a growing poulation comes a growing demand for water from the three main sectors of agriculture, around 70 percent, industry, around 22 percent and domestic use, around 8 percent. This increase in demand will cause a shortfall of almost 2000 megaliters of water by 2030. |
|
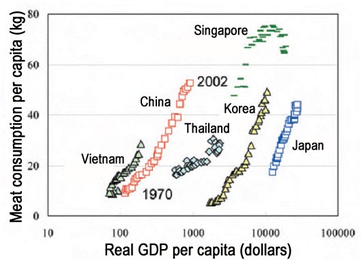
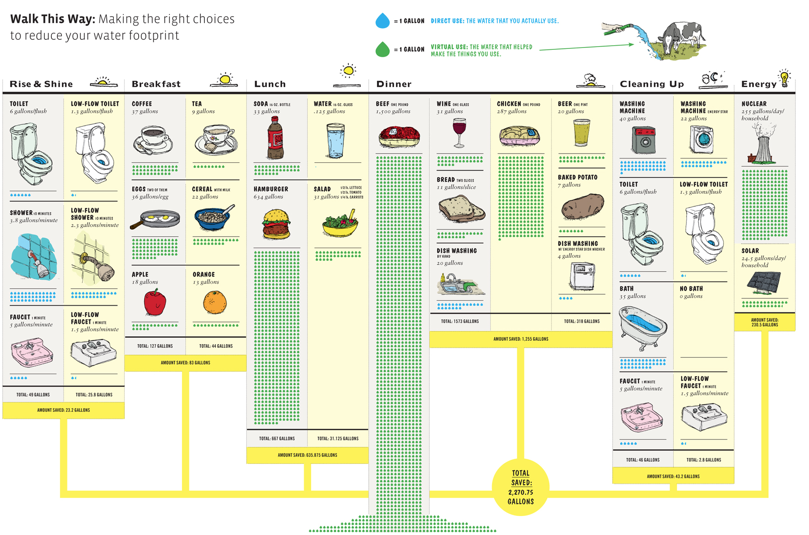
With increased wealth comes increased water demand. This is not only as a result of increased agriculture and industrial demand but also through domestic demand, much of which is virtual water that stays hidden. For example it takes 5500 liters of water to produce 1kg of beef and 2,720 litres of water to produce one cotton T-shirt. As consumer culture grows in a country so too does its use of virtual water. In other ways, demand for domestic appliances, showers and baths etc also increases water supply. The graphic to the left shows how the demand for meat increased with all the emerging economies. Explore the infographic below by clicking on it you can zoom in and zoom out.
|
|
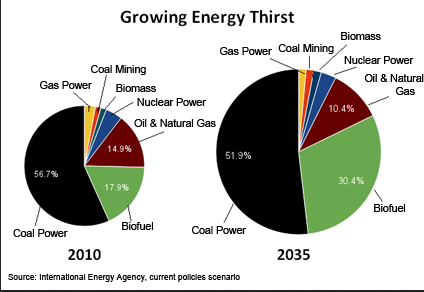
Our dependence on fossil fuel energy is also a growing issue that relates to water use, with China emerging as a global superpower and heavily dependent on coal power stations. The pie charts show what percentage of water use is required by each individual energy sector. The thirstiest being coal power stations and quickly followed by the emerging (greener?) alternative of biofuels. |
|
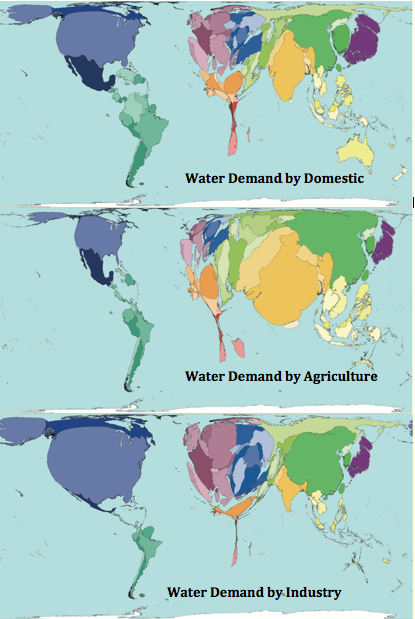
The worldmapper maps to the left show the three main demands for water. As you can see their importance varies from region to region. Europe, USA, Japan and China have big industrial footprints on water use. India, China and Egypt have relatively large agricultural demands on water and the USA, Europe and Japan have the biggest domestic demands on water.
Activity The following video is excellent on both growing demand for water and water quality issues. |
Water Scarcity
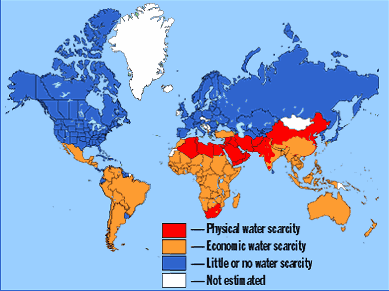
Water is not equally distributed around the world. Some places have an abundance of water but others have real shortages. Some regions manage their water as if it was an unlimited supply with little thought to sustainability whilst some regions, namely Sub-Saharan Africa struggle to survive with poor water access and sanitation. Water scarcity in Sub-Saharan Africa restricts its ability to develop and in the future more regions of the world will begin to experience economic and social hardship as a result of water scarcity.
Activity
Describe the pattern of water scarcity in the world
Activity
Describe the pattern of water scarcity in the world
|
Watch the video and make a list of the problems caused by dirty water and poor sanitation.
|
Exam Tip!
Refer to the general pattern first, e.g. North South divide and then refer to specific places and regions. Remember to refer to both water scarcity regions and water abundance regions |
|
|
The Demand for Water In China.
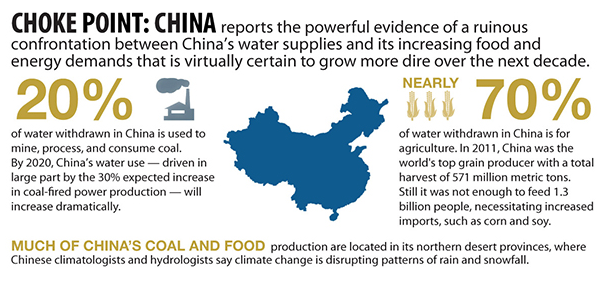
China has an enormous problem concerning water. With population growth, rapid industrialisation, water pollution and climate change this problem is only likely to get worse in the future.
The graph below shows the increase in water demand in China as well as showing the area of water surplus, moderate and severe water shortage. The video also explains this pattern and links it to an emerging energy crisis.

|
|
Exam Tip!
Improve your explanation with the use of specific facts linked to a case study.
Here are some facts for China and water demand.
Growing Demand & Industrialisation
The growing demand for water is in part caused by China’s industrialization. Annual GDP growth in China is 7-8%.
Urban China and industry consume 180 billion cubic metres of water per year or over 20 per cent of the total
Depending on the product industry in China uses 3 to 10 times more water, than indudtry in developed countries.
Agriculture
As global food prices increase, China wants to increase its grain agriculture, a very water-intensive practice. China was the biggest grain producer in the world in 2012.
Increasing proportions of meat in Chinese diets. Remember 1kg beef = 2720 liters of water
Twenty-five years from now, more than half of China's water supply will be used for irrigation to feed its growing population
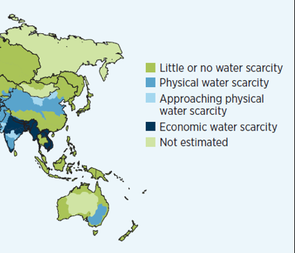
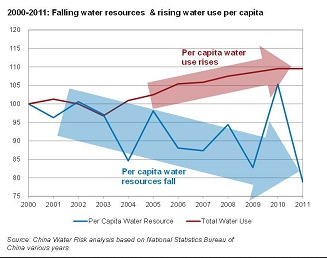
The following map and graph shows the variation in water scarcity across China and the emerging water crisis as demand for water increases in China and supply begins to fall.
Improve your explanation with the use of specific facts linked to a case study.
Here are some facts for China and water demand.
Growing Demand & Industrialisation
The growing demand for water is in part caused by China’s industrialization. Annual GDP growth in China is 7-8%.
Urban China and industry consume 180 billion cubic metres of water per year or over 20 per cent of the total
Depending on the product industry in China uses 3 to 10 times more water, than indudtry in developed countries.
Agriculture
As global food prices increase, China wants to increase its grain agriculture, a very water-intensive practice. China was the biggest grain producer in the world in 2012.
Increasing proportions of meat in Chinese diets. Remember 1kg beef = 2720 liters of water
Twenty-five years from now, more than half of China's water supply will be used for irrigation to feed its growing population
The following map and graph shows the variation in water scarcity across China and the emerging water crisis as demand for water increases in China and supply begins to fall.
|
|
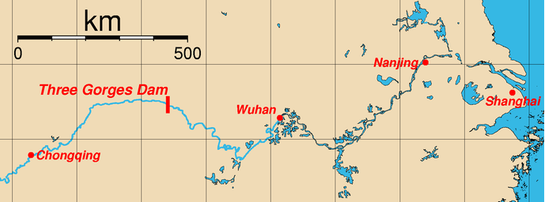
China's largest industrial and urban areas are located in the North East of China. This region has a water scarcity problem. The challenge for China is how does it get water from the areas with no or little water scarcity in the south to areas with physical water scarcity in the north.
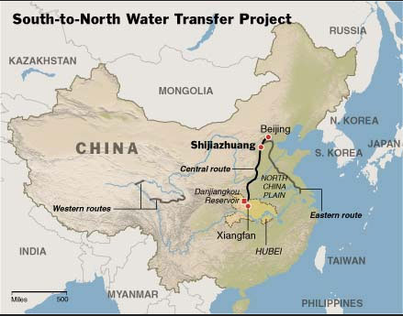
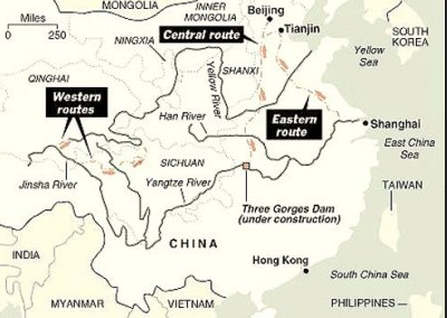
China has an ambitious plan - the South-to-North Water Transfer Project!
China intends to build a massive open and underground canal structure to transport water from the Yangtze to the Yellow River. In total there will be three routes that runs 1000s of kms over land and cuts through earthquake mountain ranges. The project which will cost over $60 billion will not be completed until 2050.
|
|
|
|
|
Water Quality
Water quality varies from place to place and region to region due to a number of reasons. Water quality is high in many developed countries because of water treatment, good infrastructure and strict environmental policies. However some developed countries take water quality less seriously and pollute water through agricultural run-off, sewage, waste and industry.
Developing countries struggle with infrastrusture to provide clean water and adeqaute sanitation. These problems are worst in urban slums. Rapidly developing countries like China and India place the importance on economic development with devestating consequences for the environment and water quality. The Chinese argue that they are just following the example of Europe and USA as they developed through the industrial revolution.
Developing countries struggle with infrastrusture to provide clean water and adeqaute sanitation. These problems are worst in urban slums. Rapidly developing countries like China and India place the importance on economic development with devestating consequences for the environment and water quality. The Chinese argue that they are just following the example of Europe and USA as they developed through the industrial revolution.
|
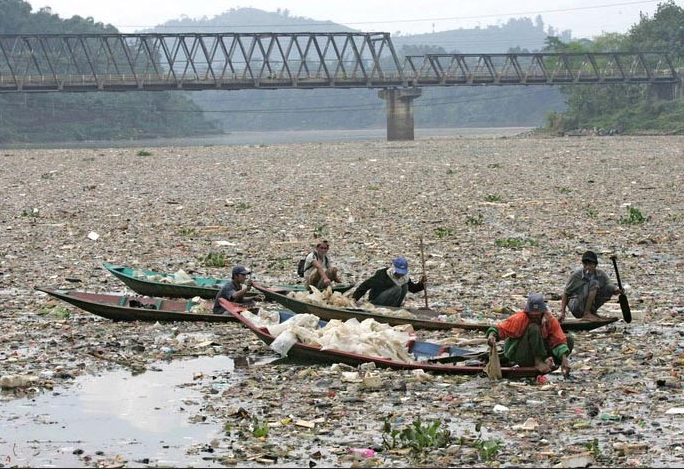
A Chinese River
|
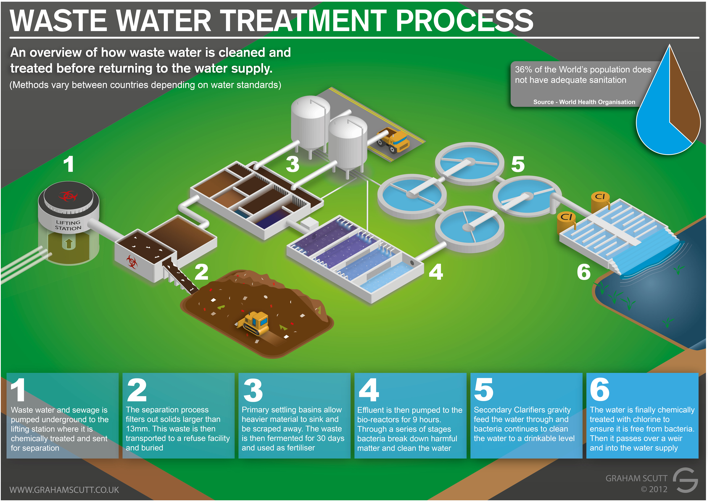
Water Quality in Developed Countries
Developed countries like those in the European Union have very sophisticated infrastructure for the management of water quality. This includes drainage and the separation of sewage from run-off as well as sewage treatment plants. Strict environmental policy and regulation prevents farmers and industry from polluting rivers although this is still a problem. Industrial pollution is localised and tends to be short term. Agricultural run-off from pesticides and fertilizers can cause eutrophication of rivers and lakes and sometimes drainage sytems become overwhelmed by floods. As a consequence sewage enters the river system.
Not all developed countries manage their water effectively. The second video below desribes the terrible water quality in the River Cephisus in Athens and the final video shows how agricultural run-off and chanelisation of the River Kissimmee in Florida has caused terrible eutrophication in Lake Okeechobee.
|
|
|
Water Quality in Developing Countries
Water quality is much worse in developing countries although this is polarised due to massive differences in wealth. Low Income Countries (LICs) struggle to manage water supply adequately and lack the infrastructure to transport clean water and sewage. Almost 1 billion people worldwide are without access to clean water. They extract their water from open rivers and ponds. This water is often dirty and contaminated. The result is frequent illness and high child mortality (deaths). Other LICs, often with the help of Non-Government Organisations (NGOs) have bore holes so that people can extract water directly from the groundwater supply, although this is still very slow and inefficient. Countries that are rapidly developing pollute their water systems to an extent that it is bad for human health.
However, some developing countries have ancient and sophisticated water transport infrastructure such as Iran with its network of 37000 active. These underground qanats are amazingly effective and incredibly inventive, but today they are old and in constant need of maintenance. The dangers of maintaining these qanats for many today would be considered to high.
|
|
|
|
|
|
Exam Tip!
It is not always black and white!
When describing how quality varies, use many place examples and
try to describe the best and worst of both LICs and HICs.
It is not always black and white!
When describing how quality varies, use many place examples and
try to describe the best and worst of both LICs and HICs.
A Water Storage Project: The 3-Gorges Dam
The three gorges dam was contructed between 1994 and 2012 at an estimated cost of $22.5 billion. Its location is on the Yangtze River. The dam reservoir is on average about 660 kilometres in length and 1.12 kilometres in width. It contains 39.3 km3 of water and has a total surface area of 1,045 square kilometres. On completion, the reservoir flooded a total area of 632 square kilometres of land.
|
Impacts
Benefits
|
Costs
- 1,300 archaeological sites and altered the appearance of the Three Gorges landscape
- Sedimentation and increased erosion is on the rise. Erosion in the reservoir, induced by rising water, causes frequent major landslides. In May 2009 between 20,000 and 50,000 cubic metres of material plunged into the flooded Wuxia Gorge. This sediment will build up behind the dam
- The dam sits in seismicly active fault zone. Weighting may increase the liklihood of earthquakes
- Between 1 and 2 million people were displaced by the reservoir and given inadequate compensation.
- Rates of erosion downstream are likely to increase due to discharge charges from the hydroelectricity station
- The dam is likely to negatively affect biodiversity and dramatically change the natural ecosystem
|
|
|
Floods and Flood Management
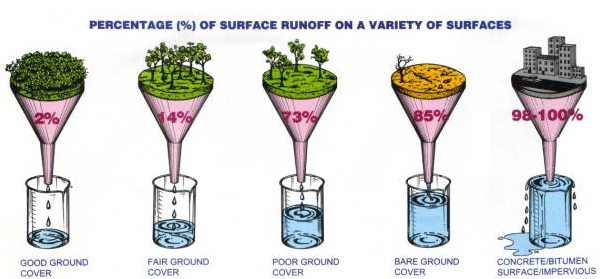
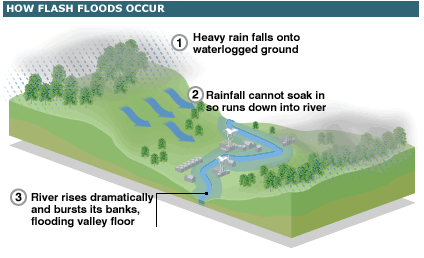
Floods result from many factors that cause surface run-off and prevent infiltration. Surface run-off is the fastest route for water to enter the river. If water is able to infiltrate it takes longer to enter the river and the chances of flooding is greatly reduced. Many factors can lead to surface run-off.
|
|
|
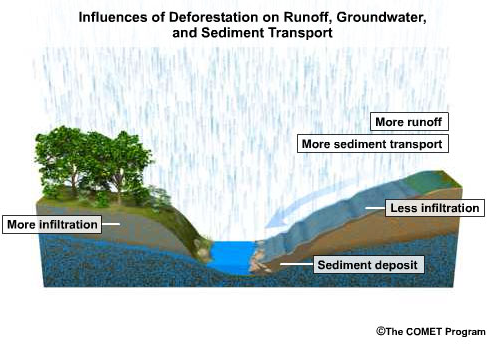
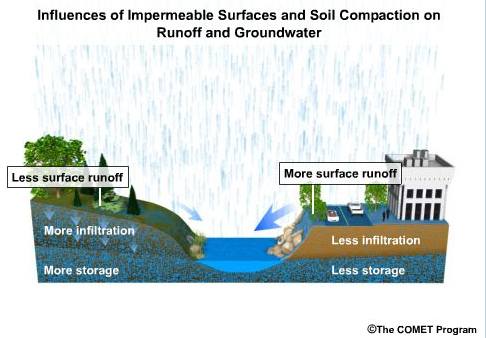
Many factors cause surface run-off. The main factor however is the removal of vegetation cover. This is done for agriculture and urban development. Soils intercept less rainfall and transpiration is reduced in fields. Urban areas have impermeable surfaces and drainage that quickly transports water into rivers. Other factors include, heavy and prelonged rainfall, which causes saturation of soils, impermeable rock and steep slopes. |
Humans can cause flooding on a large scale through deforestation and urbanisation. Deforestation reduces interception, increases surface run-off and inceases soil erosion rates and sedimentation. Building houses and roads on the floodplain adds to the impacts of floods. River diversion at a local scale and bridges can also create bottlenecks that make floods worse.
Physical factors relate to the type of soils and rock a drainage basin supports as this influences the density of vegetation cover. Impermeable rocks increase surface run-off and support less vegetation. Large drainage basins with high density of tributaries are more likely to flood due to the amount of water being drained on the surface. In addition steep relief moves water quickly into rivers.
Physical factors relate to the type of soils and rock a drainage basin supports as this influences the density of vegetation cover. Impermeable rocks increase surface run-off and support less vegetation. Large drainage basins with high density of tributaries are more likely to flood due to the amount of water being drained on the surface. In addition steep relief moves water quickly into rivers.
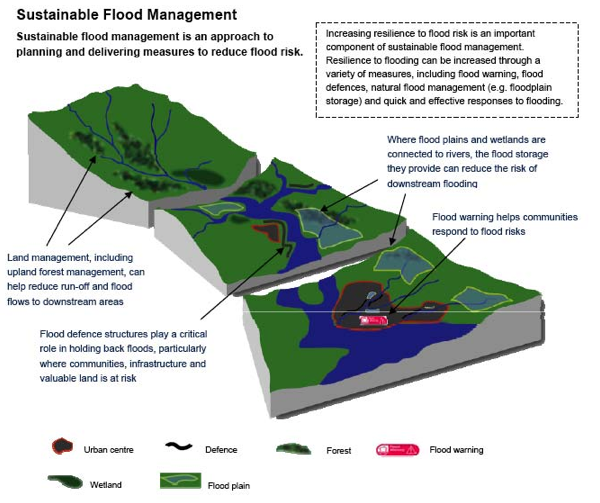
Flood Management
Floods can be managed. Often this involves trying to lengthen the amount of time it takes for water to reach the river channel, thereby increasing the lag time. Flood management techniques can be divided into hard- and soft-engineering options.
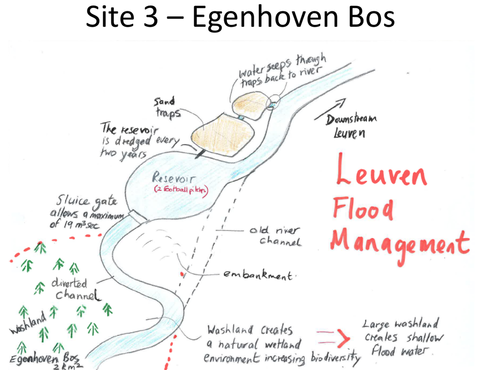
Hard options use technolgy and man-made structures to prevent flooding. It tends to be more expensive and have a greater impact on the river and its environment. Soft options are more ecologically sensitive. Urban areas require more hard engineering and rural areas have the space to use softer approaches. Often authorities are adopting a combination of the two in an integrated project like that of Dijle Valley near Leuven, Belgium. An example of an intgrated approach can be seen in the diagram below and in the PowerPoint resource for Leuven linked to in the sketch map
Hard options use technolgy and man-made structures to prevent flooding. It tends to be more expensive and have a greater impact on the river and its environment. Soft options are more ecologically sensitive. Urban areas require more hard engineering and rural areas have the space to use softer approaches. Often authorities are adopting a combination of the two in an integrated project like that of Dijle Valley near Leuven, Belgium. An example of an intgrated approach can be seen in the diagram below and in the PowerPoint resource for Leuven linked to in the sketch map
|
|
|
Hard engineering uses technology and man-made structures to restrict flooding. Hard engineering can prevent floods in the short term. In the long term floods can be made worse, if defenses have not been built to manage a 100 year flood event or if management is fragmented across the drainage basin. In this way one town upstream might be protected but flooding is made worse for a town downstream. Examples of more traditional hard engineering can be seen in the PowerPoint below. Just click on the image.