Urban Environments
The Nature of Urbanisation
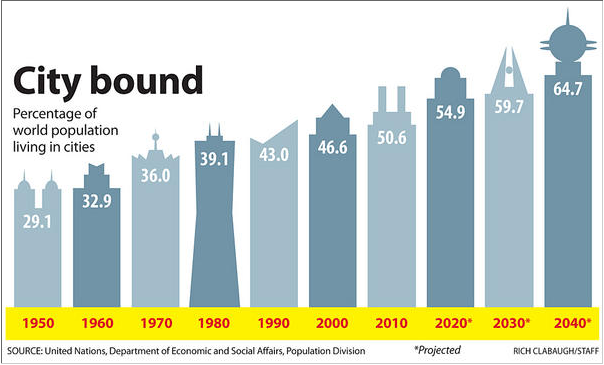
Urbanisation refers to the movement of people from the countryside to the city. Urbanisation today represents the biggest migration phenomina in history. Current urban population stands at over 3.6 billion people and is expected to rise to two thirds of the world population in 2050. This will be approximately 6 billion people. Most HICS are already urbanised so the vast majority of the urbanisation today is taking place in LICs. The following map takes you to the BBCs interactive urban growth map.
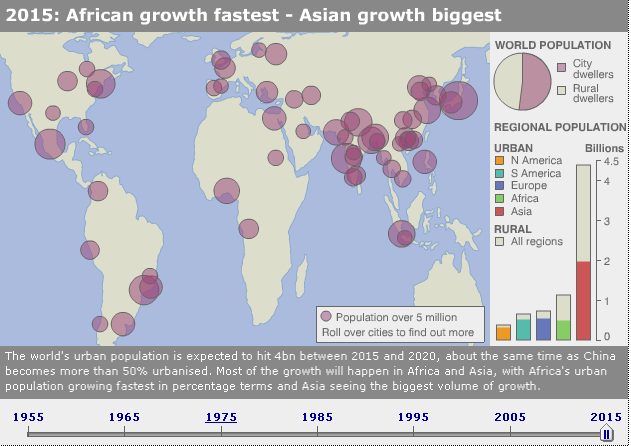
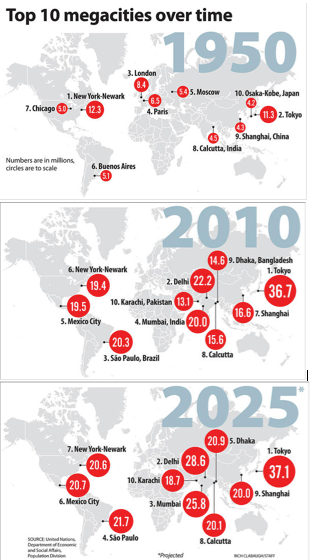
Most urbanisation in the next 50 years is expected to take place in Africa and Asia and as result the number of megacities in the world will grow. A megacity is defined as a city with a greater population than 10 million people.
|
|
|
|
There are many factors causing this mass migration. These can be divided into push and pull factors. Push factors are negative conditions of rural areas that make people leave and pull factor are positive conditions of urban areas that attract people to them.
The main push factors today are:
|
|
The main pull factors today are:
|
|

Problems of Rapid Population Growth
As cities draw in people from the countryside they begin to place huge pressure on the resources of the city and cities just grow outwards in a process called urban sprawl. Water stress, sanitation, housing capacity and road networks all become blocked and these problems are visible every where you look. From Dhaka to Naorobi and from Cairo to Mexico City megacities are struggling to keep up with their rapidly growing populations. Mexico city provides the perfect example of urban sprawl where it is grown unplanned where 60 percent of the city has grown through informal construction, from slum and shack to thriving urban center. This all happens unplanned and unregulated with no consideration to the available resources and infrastructure required. The following videos shows both the positives and negatives of urbanization in Mexico City.
Activity
Using the two videos write your own case study notes on the problems faced by megacities
Activity
Using the two videos write your own case study notes on the problems faced by megacities
|
|
|
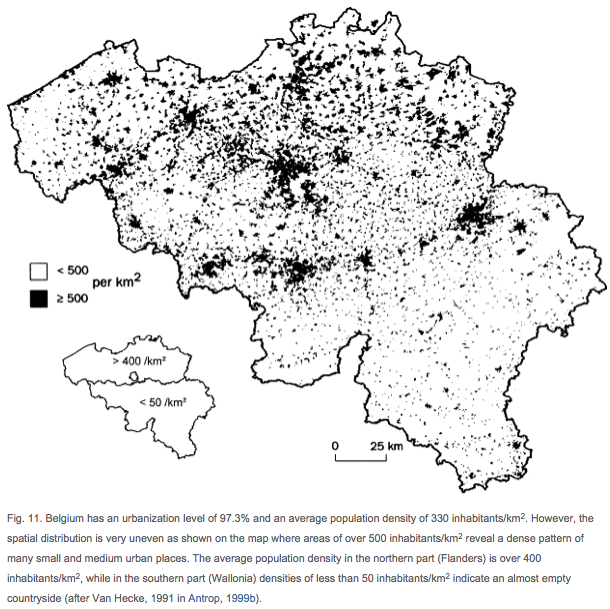
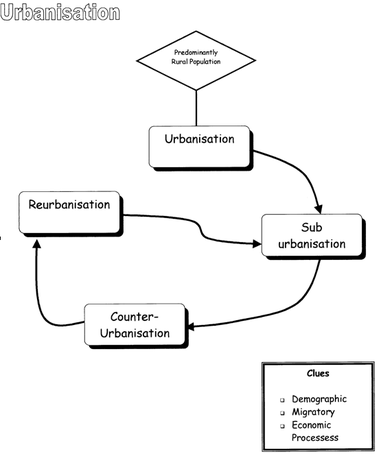
Urbanisation in HICS is less obvious as the major movement of people from the countryside to urban areas has already taken place. This is shown in the map below of Belgium, which is over 97 percent urbanised. The pattern of urbanisation in HICs follows changing flows over time. Sometime cities grow in size but decline due to overcrowding and urban problems. Later cities regenerate and begin to attract people back to the city. This changing pattern of migration can be seen in the process of counter urbanisation and reurbanisation.
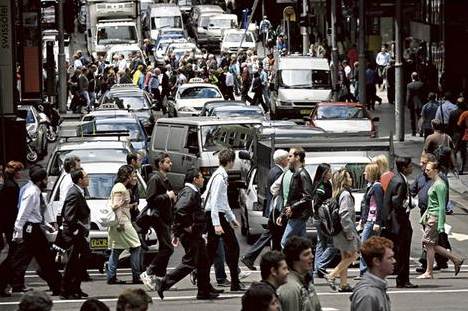
The problem of overcrowded cities with all the associated problems of congestion, transport, employment, crime and environmental quality are not just confined to megacities in LICs, they are a problem in all cities. However the big difference between cities in HICs and LICs is related to transport infrastructure. HIC cities have sophisticated road and rail networks and integrated public transport systems that have allowed wealthier inhabitants of the city to migrate towards the rural urban fringe. As a consequence places called the suburbs and commuter villages have been established. This type of migration can be divided into two types, suburbanisation and counter urbanisation. This process of migration can be seen in the diagram below.
Push Factors Pull Factors
Congestion and air quality Clean air and environment
Noise and overcrowded Quiet and space
Growing petty and serious crime Safety
Child unfriendly and challenging schools Child friendly and stronger schools
Changing industry Footloose industry locating in RUF
Greater ethnicity Single ethnic identity
Activity
Identify the specific push and pull factors for each type of migration shown in the diagram.
The Urban Environment
As cities develop they form quite distinctive land use patterns and socio-economic and ethnic groups become more segregated. The key reason for this is beacuse of the cost of land and housing and so affordability determines what functions and services develop and where people live. However other factors such as the cultural needs of the people and the accessibility to labour or resources for industry are also important. The following video is based on New Towns in the UK but it also is a good introduction to how cities evolve and grow and how specific zones with different land uses develop in different places.
|
|
|
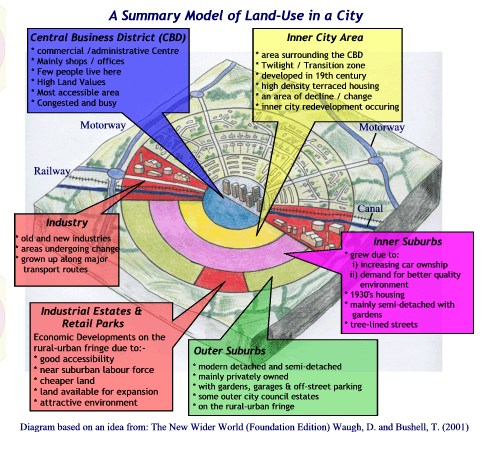
The main theory about land use zones in city identifies different landuse zones. These include the:
Central Business District (CBD) - high rise and/or historical, heavy congestion, shops, banks and offices
Industry - generally heavy industry, smokestacks and warehouses, many closed down and light manufacturing
Low Income Residential - Terraced houses (rows) and low cost apartments (flats), high density population, no living space and inadequate road and public transport network
Middle Income Residential - Semi-detached built 1960's (two houses joined), some garden space and better road and public transport network
High Income Residential - Detached houses (single) large, expensive, modern beg garden space and park space, excellent road and public transport network.
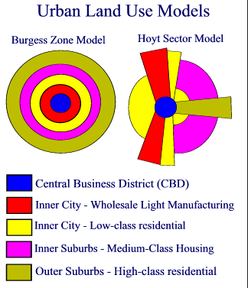
There are several models for urban landuse in HICs. The Burgess Concentric Model and Hoyte's Sector Model are two well known models.
Central Business District (CBD) - high rise and/or historical, heavy congestion, shops, banks and offices
Industry - generally heavy industry, smokestacks and warehouses, many closed down and light manufacturing
Low Income Residential - Terraced houses (rows) and low cost apartments (flats), high density population, no living space and inadequate road and public transport network
Middle Income Residential - Semi-detached built 1960's (two houses joined), some garden space and better road and public transport network
High Income Residential - Detached houses (single) large, expensive, modern beg garden space and park space, excellent road and public transport network.
There are several models for urban landuse in HICs. The Burgess Concentric Model and Hoyte's Sector Model are two well known models.
|
NB: Please Use income rather than class
Activity Describe the similarities and differences betwen the two models Explain why low income residential is located close to Industry Explain why high income residential develops as a sector |
Explaining the Land use Zones
|
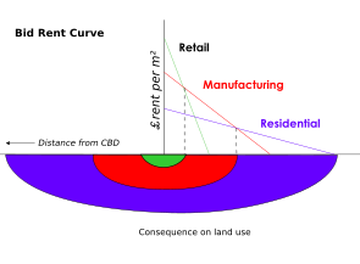
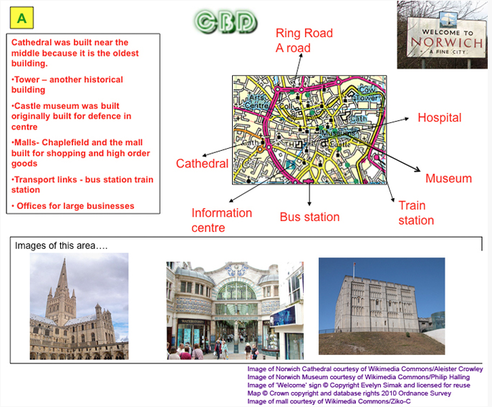
The CBD is dominated by tall buildings of high value.It is typically a centre for shops and offices. All public transport and road networks lead you to the CBD (nodal point) and it is full of people working and shopping. Two main reasons explain the functions. The first is land price, referred to as bid-rent value. The cost of land is highest in the CBD and the only functions that can afford the land is retail and the head offices of multinationals. The second reason is sphere of influence. This is the disatnce that people are willing to travel to go to a place. One shop has a limited spehere of influence but a CBD has a much bigger one. The City of London has a global spher of influence. for example wealthy Chinese visit to by high end fashion.
|
|
|
|
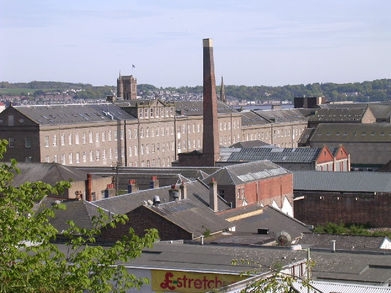
The Inner City Industrial Zone is generally in decline. Heavy manufacturing in HICs have mostly closed down or migrated to lower cost sites outside the city with better transport connections. This zone is either derelict or in a process of regeneration. Some warehouses are being converted to open office blocks or modern apartments. Government policy has incentivised companies to invest in these zones and flagship companies move in e.g. Ikea in Andelechte. Sites being redeveloped are called brownfield sites as they have already been built on. This zone is also known as a Zone of Transition. |
|
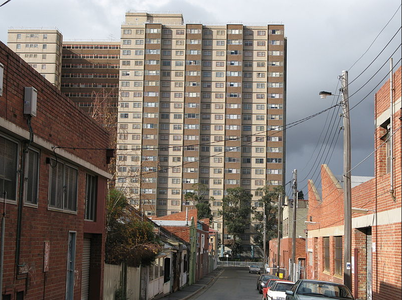
Inner city low income housing is located close to the CBD and old industrial areas. Traditionally it was made up of rows of compact terraced houses, with a back yard. Later many of these houses were considered slums and were knoocked down and replaced with high rise flats. The main feature of the inner city is high density housing. Land value is still quite expensive still so houses are small. There is limited space for parking and gardens with very little open space. Low income groups live here because of the access to low skilled jobs in the industry zones and CBD. This zone also attracts first time buyers who have disposable income to renovate the houses. This is called gentrification. Some parts of the inner city become ethnically segregated.
|
|
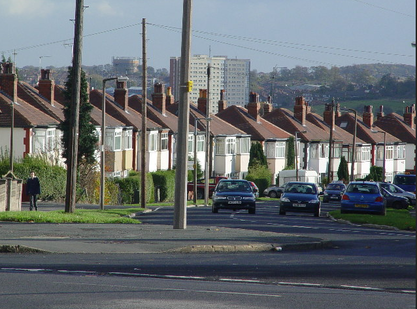
Middle income housing areas are found further away from the inner city and are characterised by larger housing, often semi-detatched with both front and back gardens. They developed later as cities grew outwards for those who caould afford it. There is normally a more modern road infrastructure and good public transport connections. Larger public parks are also common in this area. Smaller service centers with their own shops and functions develop in these zones. High land prices create secondary nodes in value but this doesn't compare to the value of land at the CBD. |
|
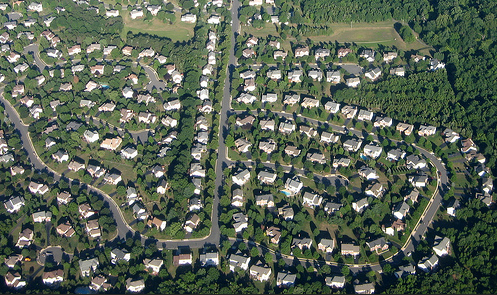
The suburbs developed on the outskirts of the city for high income social groups. They are generally large detatched houses with sizable gardens. People rely on cars and public transport and so the suburbs are very well connected to the road and public transport network. Some suburbs extend into the Rural Urban Fringe. There is a lot of open space and parkland. Land value is cheaper so people can afford to buy large houses but the value of homes restricts people in lower income groups from living there. |
Activity
Explore the changing city of Norwich through OS maps and photographs by clicking on the CBD image below. Explore the characteristics of urban zones with the interactive model below, produced by Rob Chambers.
Explore the changing city of Norwich through OS maps and photographs by clicking on the CBD image below. Explore the characteristics of urban zones with the interactive model below, produced by Rob Chambers.
|
|
Ethnic Segregation
So far we have explained socio-economic segregation in cities. Cities are divided into zones due to people's earnings and the affordability of houses. However, it is also possible to see social segregation with ethnicity.
|
Ethnic segregation develops for many reasons. These include:
|
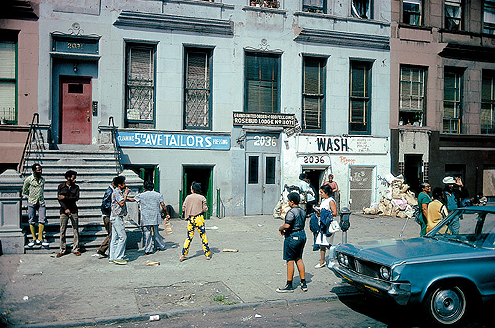
The consequences of social and ethnic segregation need to be discussed in regard to time scale. In the short term segregated cities enable people to settle into a place and find their way. A cultural support network of people and services is available and this enables people to live relatively happy and secure lives. In some examples these regions can economically thrive like China Town in London. However in the long term ethnic segregation does not bring many positives. Ethnic minority groups feel cut off from the rest of the city and the majority group have a misimformed perception of threat based largely on media representation. When government investment neglects these areas of the city, ethnic groups become detatched from the city and a feeling of resentment develops. At worst segregated zones become no-go zones for the majority group. Some places become lawless, where even the police are afraid to enter. USA has experienced the worst of social segregation in many of its cities. France and the UK both experienced riots recently based on ethnic and socio/economic divides.
|
|
|
|
|
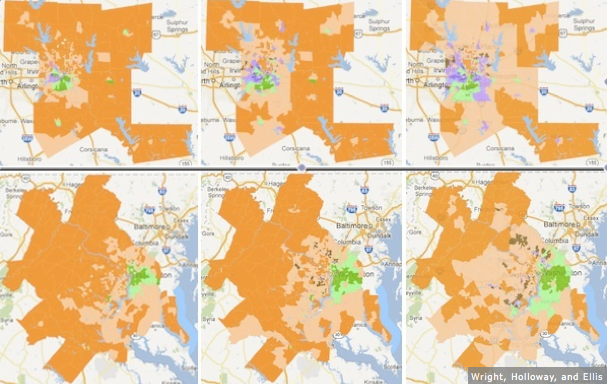
The following video featuring Professor Richard Wright from Dartmouth University explains how segregation in US cities appears to be reducing. White dominated zones are beoming more diverse as are hispanic dominated zones. However the data reveals that African American dominated zones are getting stronger. Click on the map and explore the level of ethnic segregation in US cities.
|
|
|
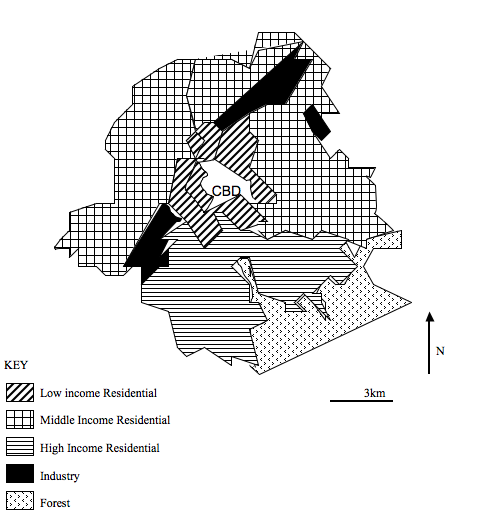
Case Study: Land use Patterns and Social-Ethnic Groups in Brussels
The image below shows the development of Brussels as it grew outwards in different phases.
The following map shows the socio-economic groups or Brussels
|
Activity
What land use model does the map of Brussels follow? Produce a digital map with photo and images of the different zones of the Brussels overlayed Draw a landuse model of Brussels that best suits the pattern shown in the map The video below made by Charlotte Lemaitre provides a good overview of the key functions in each zone of Brussels |
Brussels has a :
- CBD in the centre, it's pentagon shaped with several key functions, historical tourism, the European sector and the Bourse retail and entertainment area
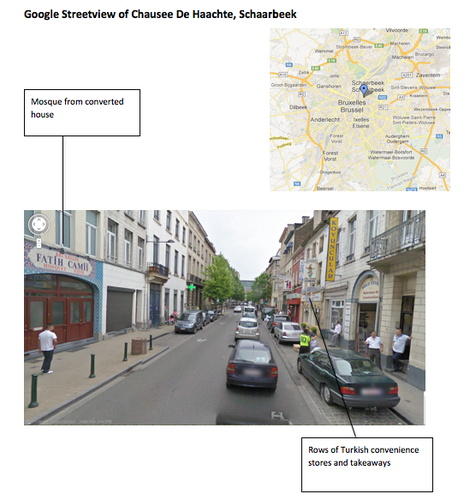
- a concentric inner city with dense low cost housing with clear social and ethinic segregation, the Marollen is the famous immigrant quater located in south section of the pentagon and Andelechte extends to the west and Schaarbbek to the east. Both have higher than average ethnic minority groups.
- two industrial sectors that follow the railway and canal routs disecting the inner city, very similar to Hoyt's model.Other idnustrial areas have located alongside the ring road and at Zaventum airport in the RUF.
- Middle income and high income residential areas following a sector pattern. High income housing towards the south near forests.
Ethnic Segregation in Brussels
The following PDF contains data on ethnic segregation in Brussels and the news report provided a rather right ring alarmist impression of the situation in Brussels.
The following PDF contains data on ethnic segregation in Brussels and the news report provided a rather right ring alarmist impression of the situation in Brussels.
|
|
LICs and Sqatter Settlements.
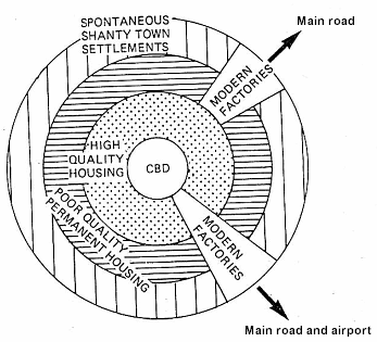
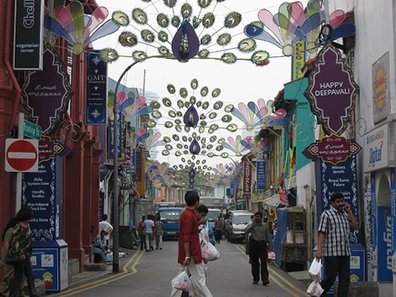
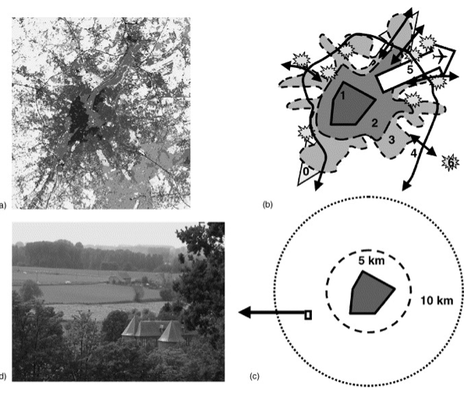
LIC cities evolve quite differently to HIC cities. Urbanisation is rapid and unplanned. With an inadequate number of low price housing available people arriving in the city are forced to build their own houses from scrap materials on the fringes of cities. These housing areas are called squatter settlements or spontaneous shanty town settlements. Over time these houses are improved and renovated and are quite often made of more solid stone structures with some access to services like water and electricity. However, despite this they often remain informal and the residents don't legally own the land. Squatter setlements can quite complex with an abundance of housing available to rent and sub-let.
The LIC land use model has some similarities to the Burgess and Hoyt models. The CBD is found in the centre. Factories are also built along major transport routes like Hoyt.
However, when it comes to housing, there are significant differences. High income housing tends to be located near the CBD. The richer people want to live near the centre to be close to centres of commerce and work. Transport networks are so poor and disorganised that commuting would be too time consuming.
Slightly further out you find low income housing areas or formal slums. On the edge, rather than high income housing we find poor squatter settlements built on marginal land. People live on the edge of the city because this is the only available land and the authorities tend not to remove them.
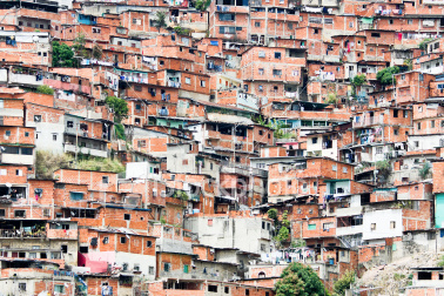
Activity
Using the photographs below describe the characteristics of squatter settlements
The LIC land use model has some similarities to the Burgess and Hoyt models. The CBD is found in the centre. Factories are also built along major transport routes like Hoyt.
However, when it comes to housing, there are significant differences. High income housing tends to be located near the CBD. The richer people want to live near the centre to be close to centres of commerce and work. Transport networks are so poor and disorganised that commuting would be too time consuming.
Slightly further out you find low income housing areas or formal slums. On the edge, rather than high income housing we find poor squatter settlements built on marginal land. People live on the edge of the city because this is the only available land and the authorities tend not to remove them.
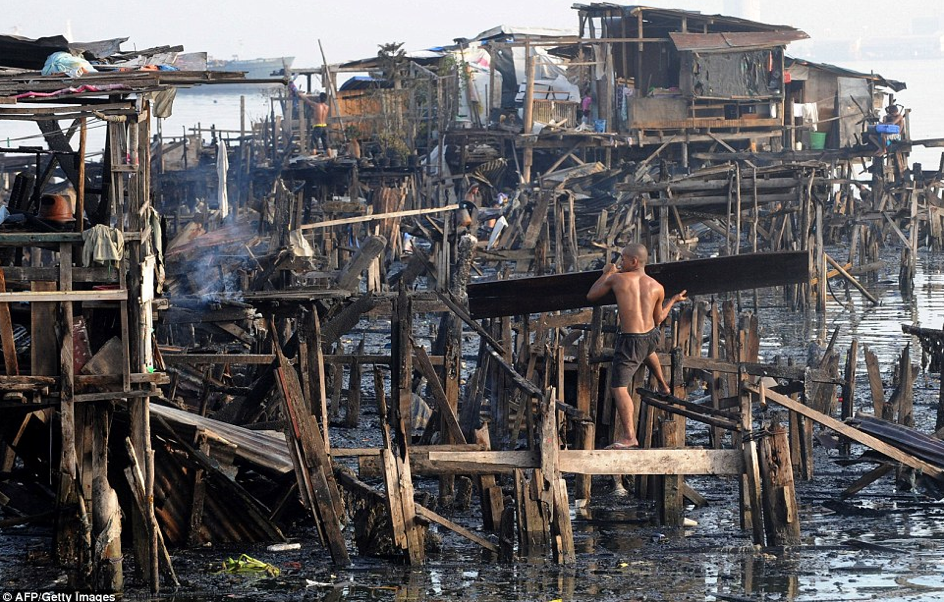
Activity
Using the photographs below describe the characteristics of squatter settlements
|
|

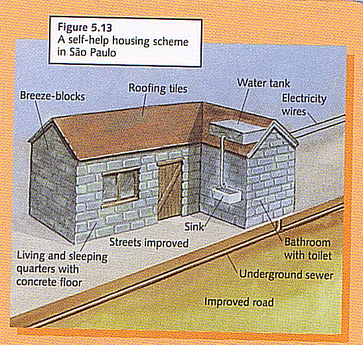
The Management of Shanty Settlements
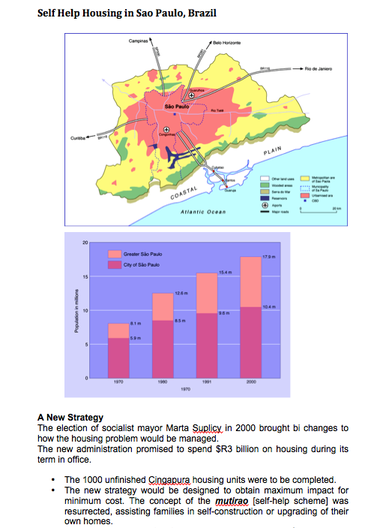
Shanty settlements need to managed if the quality life and health of the residents is to be sustained. The following video by gapmider presents the main problems of shanty towns and is based in Nairobi, Kenya. In the video there appears to be very little being done to manage the squatter settlements or slums. In contrast the diagram shows a typical self-help house from Sao Paulo. Such houses were the outcome of self-help schemes. With this scheme the Brazilian government provided the materials and secure tenure (ownership) for people either at very low cost or through affordable credit and the people bulit their own houses. In addition the govenment provided vital services such as water mains, sanitation and electricity. These schemes were provided for the people, living in the long established slums.
|
|
|
It's important to contrast a variety of different ways of managing squatter settlements, using different places. The problem of managing sqautter settlements is not an easy one to resolve. It is not easy as most countries struggle with funding housing projects. Self help schemes have been widely used in Brazil but even there when funding dries up an effective management policy is very difficult to achieve. In places like in the Kibera slum of Nairobi, very little appears to have been done and there are examples if mismanagement and forced eviction. However, despite forced eviction there are also rehousing projects. The criticism lies with the question, who benefits? Many of the local Kibera residents complain that people outside the slums have benefited from rehousing schemes and people have just sub-let the houses for profit from higher rents and stayed themselves in the slums. However as the video shows below some people are now better off than they were before.
|
|
|
The following video discusses the positives and negatives of the Dharavi Redevelopment Plan in Mumbai, India. It's a controversial rehousing project, which does promise to lift people out of the problems of poor sanitation, and poor housing, but it's a topdown strategy that has neglected the involvement of the people living in the Dharavi slums. This is a very important evaluative point when discussing any management strategy. To what extent have the local peole been invoved in the decision making? When ocal people lead the decision making process it is called a bottom-up strategy.
